本文是学习100gdb-tips的总结内容,部分代码与原文不同,补充相关调试程序中遇到的问题与解决方法。
调试已运行的程序
thread.c
#include <stdio.h>
#include <unistd.h>
#include <pthread.h>
void *thread_func(void *p_arg)
{
        while (1)
        {
                printf("%s\n", (char*)p_arg);
                sleep(10);
        }
}
int main(void)
{
        pthread_t t1, t2;

        pthread_create(&t1, NULL, thread_func, "Thread 1");
        pthread_create(&t2, NULL, thread_func, "Thread 2");

        sleep(1000);
        return 0;
}
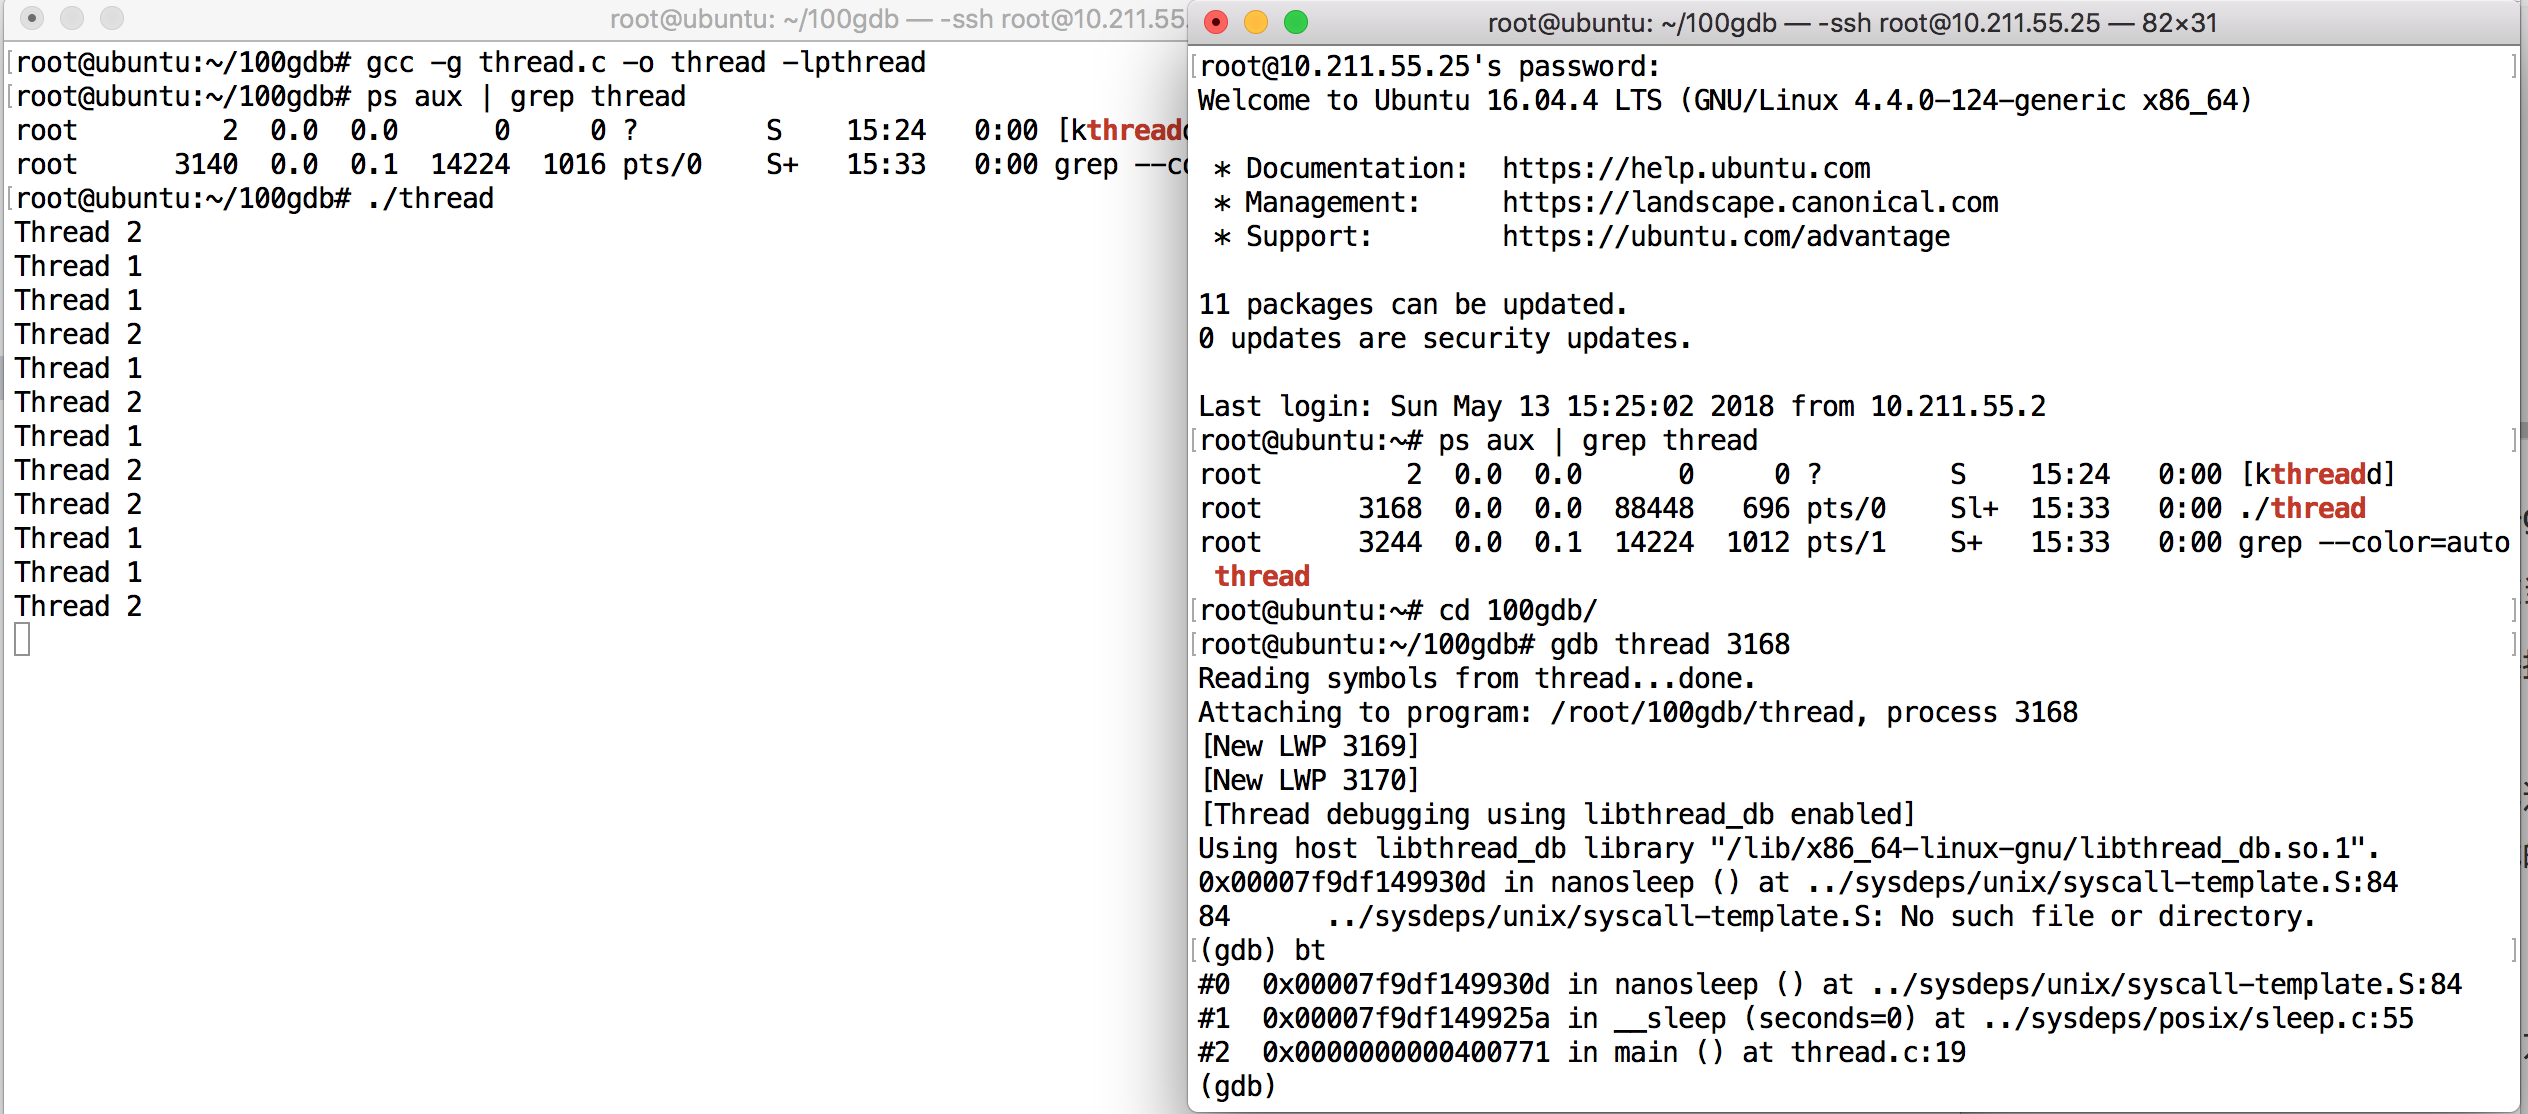
gcc -g -o thread thread.c -lpthread
然后在当前会话shell中执行./thread &
或直接执行./thread再单独开一个shell会话窗口。
调试已运行的进程有两种方法,一种是通过ps找到要调试的程序的进程号,例如上面例子可以通过ps -aux | grep thread,然后gdb thread 进程号。
另一种方法是先gdb 然后通过attach命令来调试进程。
如果不想继续调试了,可以用“detach”命令“脱离”进程:
(gdb) detach
Detaching from program: /data/nan/a, process 10210
(gdb) bt
No stack.
如果觉得每次查找进程号麻烦可以使用如下脚本:
# 保存为xgdb.sh(添加可执行权限)
# 用法 xgdb.sh program
prog_bin=$1
running_name=$(basename $prog_bin)
pid=$(pidof $running_name)
gdb attach $pid
例如我们使用./xgdb.sh thread即可调试正在运行的进程。
调试子进程
代码:
#include <stdio.h>
#include <sys/types.h>
#include <stdlib.h>
#include <unistd.h>

int main(void)
{
    pid_t pid;

    pid = fork();
    if (pid == 0)
    {
        printf("child\n");
        exit(1);
    }
    else if (pid > 0)
    {
        printf("parent\n");
        exit(0);
    }
    else
    {
        printf("error\n");
    }
    printf("hello world\n");
    return 0;
}
在调试多进程程序时,gdb默认会追踪父进程。在执行set follow-fork-mode child后可以去跟踪子进程。
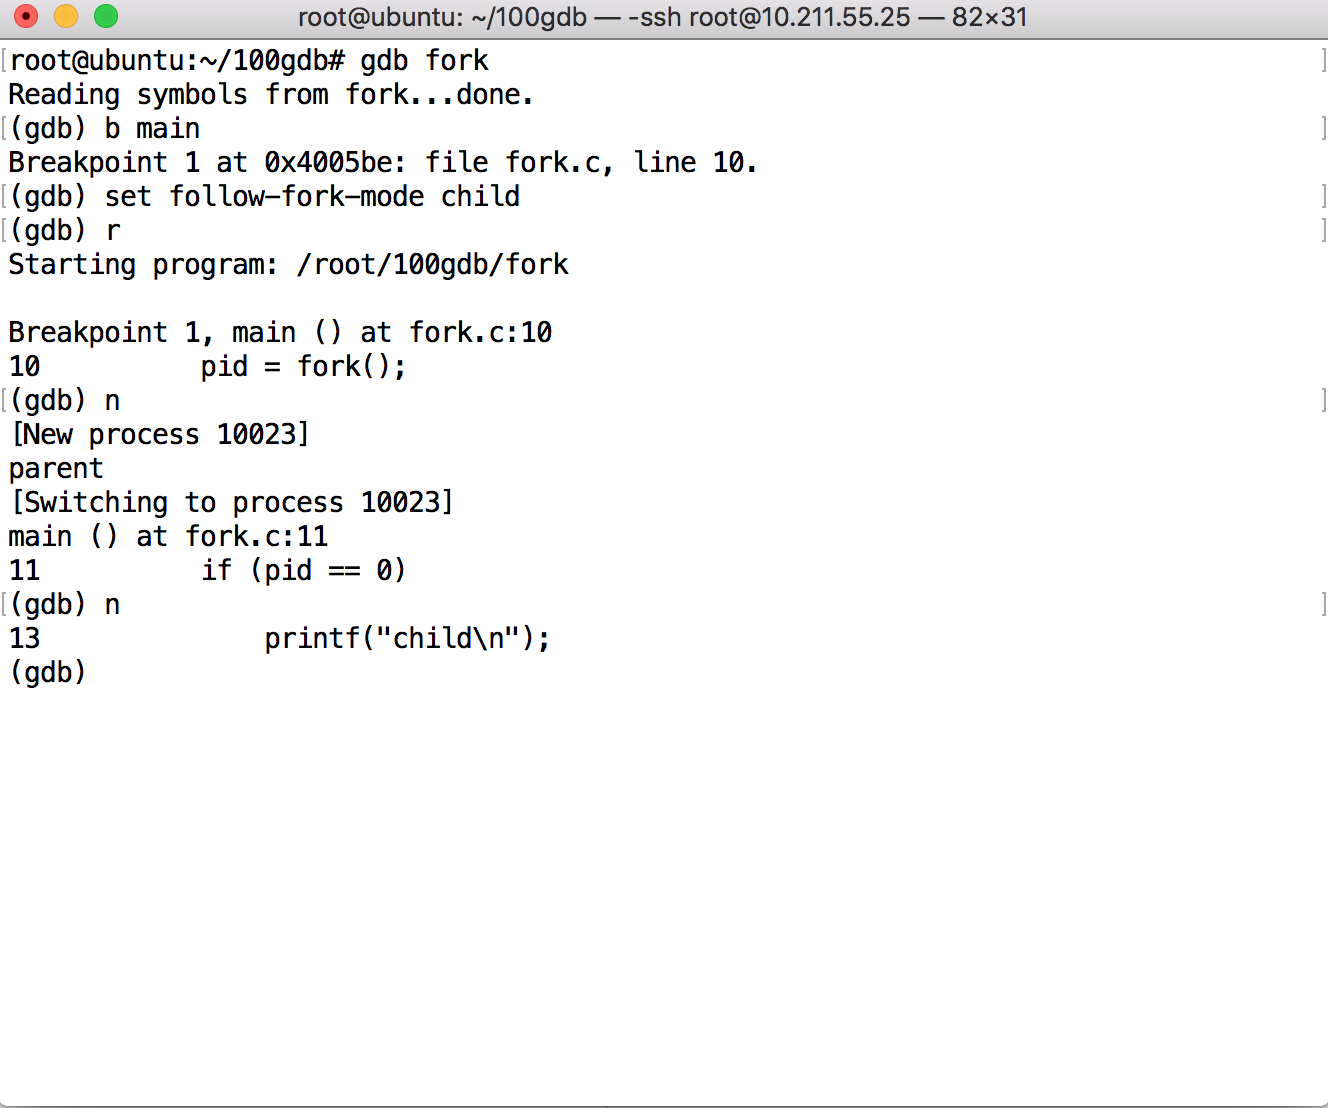
这个命令目前Linux支持,其它很多操作系统都不支持,使用时请注意。
同时调试父进程和子进程
#include <stdio.h>
#include <stdlib.h>
#include <unistd.h>
int main(void)
{
    pid_t pid;

    pid = fork();
    if (pid < 0)
    {
        exit(1);
    }
    else if (pid > 0)
    {
        printf("Parent\n");
        exit(0);
    }
    printf("Child\n");
    return 0;
}
在调试多进程程序时,gdb默认只会追踪父进程的运行,而子进程会独立运行,gdb不会控制。以上面程序为例:
Starting program: /root/100gdb/a.out
Breakpoint 1, main () at child.c:8
8 pid = fork();
(gdb) n
child
9 if (pid == 0)
(gdb) n
14 else if (pid > 0)
(gdb)
可以看到当单步执行到第8行时,程序打印出“Child” ,证明子进程已经开始独立运行。
如果要同时调试父进程和子进程,可以使用“set detach-on-fork off”(默认detach-on-fork是on)命令,这样gdb就能同时调试父子进程,并且在调试一个进程时,另外一个进程处于挂起状态。仍以上面程序为例:
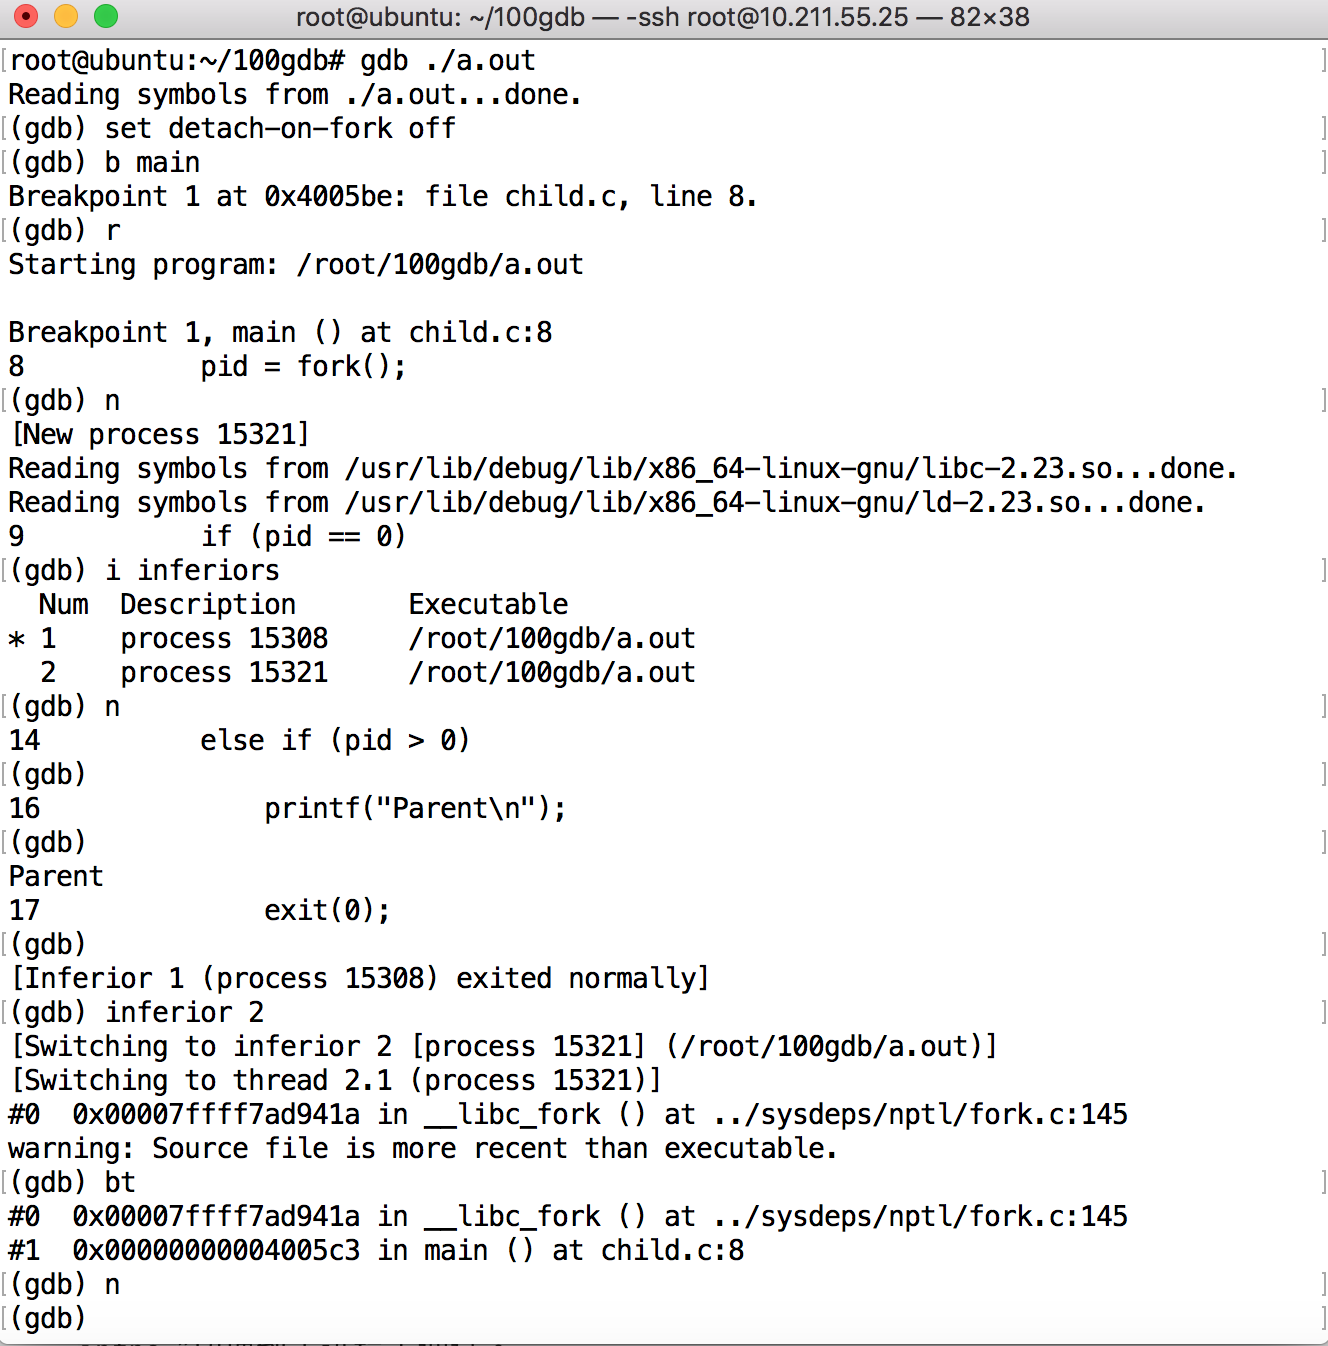
在使用“set detach-on-fork off”命令后,用“i inferiors”(i是info命令缩写)查看进程状态,可以看到父子进程都在被gdb调试的状态,前面显示“*”是正在调试的进程。当父进程退出后,用“inferior infno”切换到子进程去调试。
这个命令目前Linux支持,其它很多操作系统都不支持,使用时请注意。
此外,如果想让父子进程都同时运行,可以使用“set schedule-multiple on”命令(默认off),仍以上述代码为例:
Reading symbols from parent...
(gdb) set schedule-multiple on
(gdb) b main
Breakpoint 1 at 0x115d: file parent.c, line 8.
(gdb) r
Starting program: /root/workspace/gdb/parent

Breakpoint 1, main () at parent.c:8
8       pid = fork();
(gdb) n
[Detaching after fork from child process 28513]
Child
9       if (pid < 0)
(gdb) n
13      else if (pid > 0)
(gdb) p pid
$1 = 28513
(gdb) n
15          printf("Parent\n");
(gdb) n
Parent
16          exit(0);
(gdb) q
可以看到打印出了“Child”,证明子进程也在运行了。
查看线程信息
#include <stdio.h>
#include <pthread.h>
void *thread_func(void *p_arg)
{
        while (1)
        {
                printf("%s\n", (char*)p_arg);
                sleep(10);
        }
}
int main(void)
{
        pthread_t t1, t2;

        pthread_create(&t1, NULL, thread_func, "Thread 1");
        pthread_create(&t2, NULL, thread_func, "Thread 2");

        sleep(1000);
        return;
}
用gdb调试多线程程序,可以用“i threads”命令(i是info命令缩写)查看所有线程的信息,以上面程序为例(运行平台为Linux,CPU为X86_64):
(gdb) b main
Breakpoint 1 at 0x400722: file google.c, line 15.
(gdb) r
Starting program: /root/100gdb/a.out
[Thread debugging using libthread_db enabled]
Using host libthread_db library "/lib/x86_64-linux-gnu/libthread_db.so.1".
Breakpoint 1, main () at google.c:15
15  {
(gdb) n
18      pthread_create(&t1, NULL, thread_func, "Thread 1");
(gdb)
[New Thread 0x7ffff77ef700 (LWP 21849)]
19      pthread_create(&t2, NULL, thread_func, "Thread 2");
(gdb)
Thread 1
[New Thread 0x7ffff6fee700 (LWP 21856)]
21      sleep(1000);
(gdb) i thread
  Id   Target Id         Frame
* 1    Thread 0x7ffff7fdd700 (LWP 21836) "a.out" main () at google.c:21
  2    Thread 0x7ffff77ef700 (LWP 21849) "a.out" 0x00007ffff78bc30d in nanosleep ()
    at ../sysdeps/unix/syscall-template.S:84
  3    Thread 0x7ffff6fee700 (LWP 21856) "a.out" clone () at ../sysdeps/unix/sysv/linux/x86_64/clone.S:81
(gdb)
第一项(Id):是gdb标示每个线程的唯一ID:1,2等等。
第二项(Target Id):是具体系统平台用来标示每个线程的ID,不同平台信息可能会不同。 像当前Linux平台显示的就是: Thread 0x7ffff77ef700 (LWP 21849)。
第三项(Frame):显示的是线程执行到哪个函数。
前面带“*”表示的是“current thread”,可以理解为gdb调试多线程程序时,选择的一个“默认线程”。
可以用“i threads [Id...]”指定打印某些线程的信息,例如:
(gdb) info threads 1
  Id   Target Id                                   Frame
* 1    Thread 0x7ffff7da7740 (LWP 28527) "process" main () at process.c:20
(gdb) info threads 1 2
  Id   Target Id                                   Frame
* 1    Thread 0x7ffff7da7740 (LWP 28527) "process" main () at process.c:20
  2    Thread 0x7ffff7da6700 (LWP 28533) "process" 0x00007ffff7e8b670 in __GI___nanosleep (
    requested_time=requested_time@entry=0x7ffff7da5ea0, remaining=remaining@entry=0x7ffff7da5ea0)
    at ../sysdeps/unix/sysv/linux/nanosleep.c:28
(gdb) info threads 1
  Id   Target Id                                   Frame
* 1    Thread 0x7ffff7da7740 (LWP 28527) "process" main () at process.c:20
使用$_thread变量
#include <stdio.h>
#include <unistd.h>
#include <pthread.h>

int a = 0;
int b = 0;

void *thread1_func(void *p_arg)
{
    while (1)
    {
        a++;
        sleep(1);
    }
}

void *thread2_func(void *p_arg)
{
    while (1)
    {
        b++;
        sleep(1);
    }
}

int main(void)
{
    pthread_t t1, t2;

    pthread_create(&t1, NULL, thread1_func, "Thread 1");
    pthread_create(&t2, NULL, thread2_func, "Thread 2");

    sleep(1000);
    return 0;
}
gdb从7.2版本引入了$_thread这个“convenience variable”,用来保存当前正在调试的线程号。这个变量在写断点命令或是命令脚本时会很有用。
首先设置了观察点:“wa a”(wa是watch命令缩写),也就是当a的值发生变化时,程序会暂停,接下来在commands语句中打印线程号。
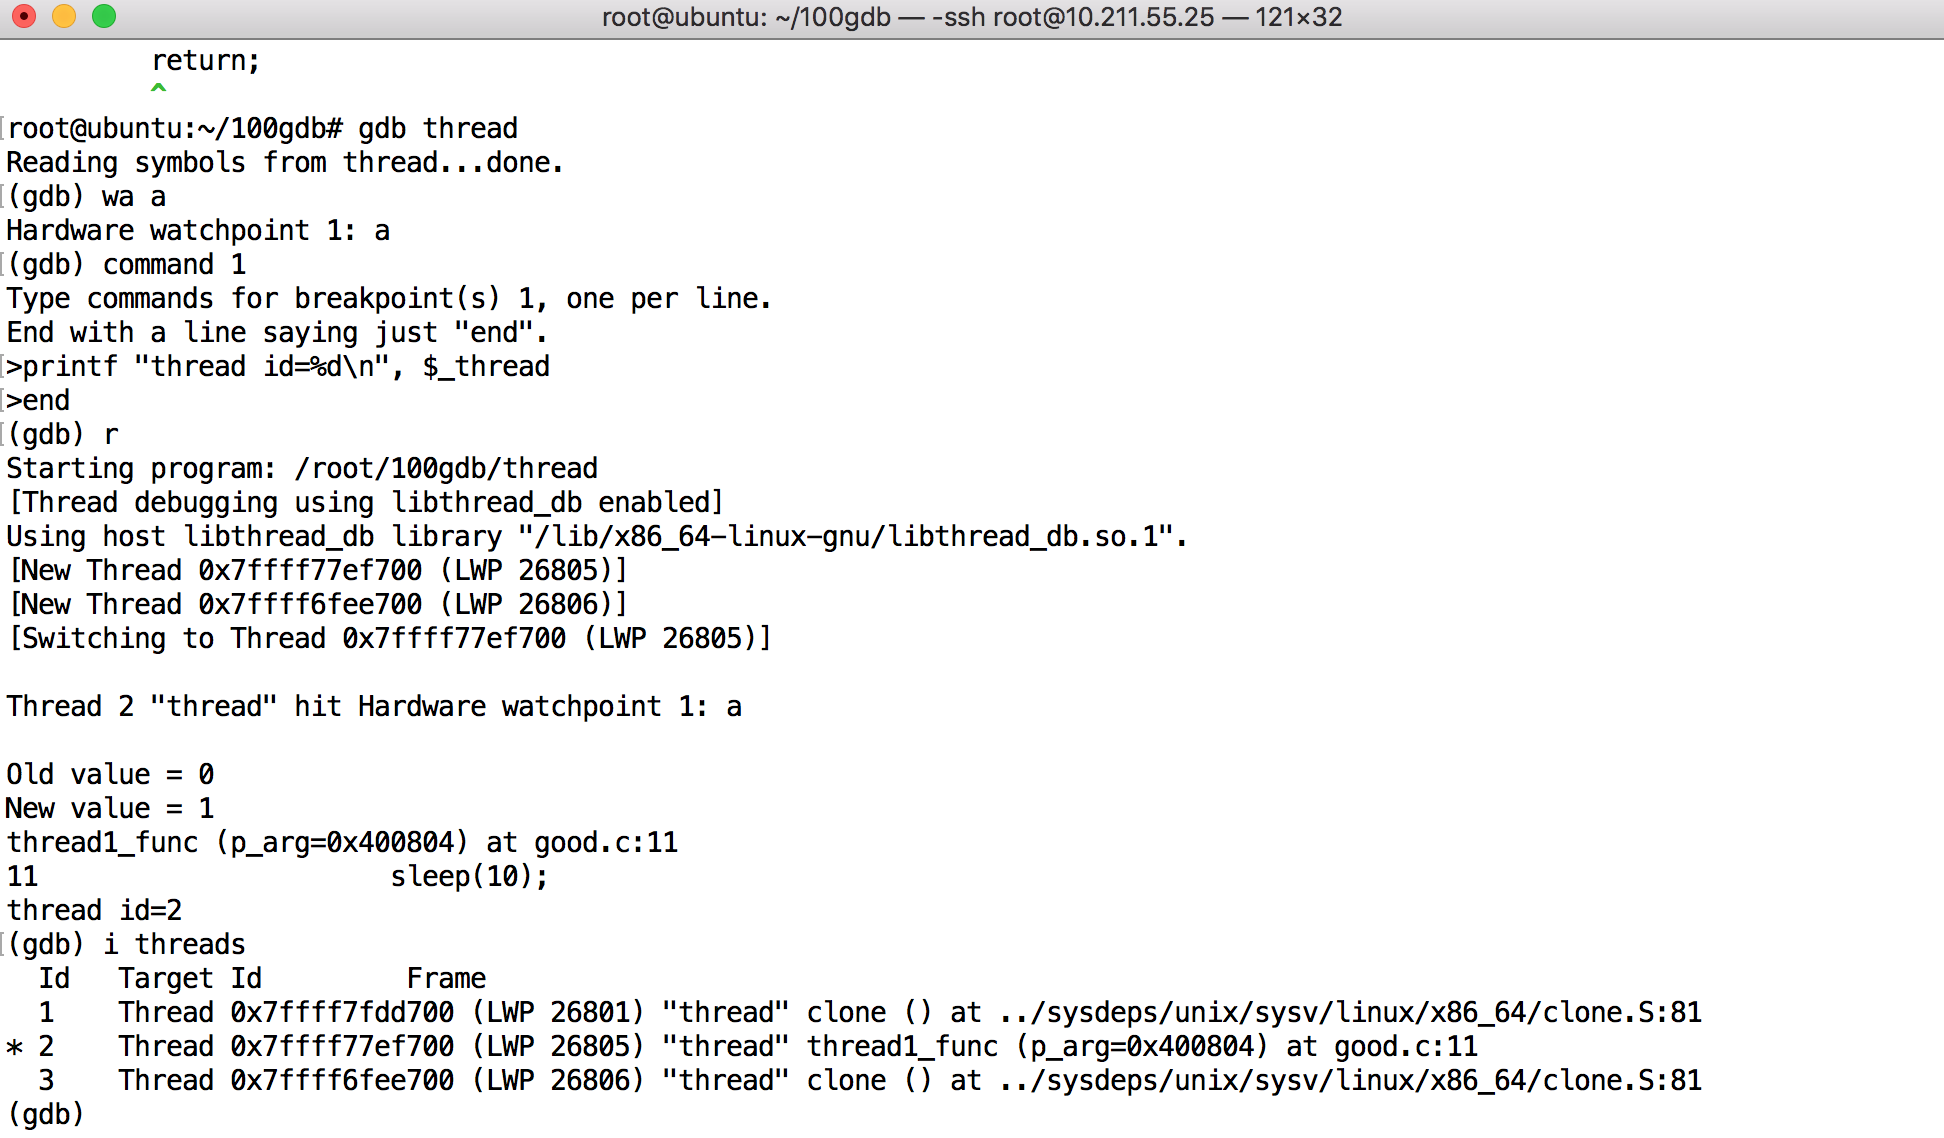
可以看到在程序中断后打印出了进程号 thread id = 2
打印所有线程的堆栈信息
#include <stdio.h>
#include <pthread.h>
#include <unistd.h>

void *thread_func(void *p_arg)
{
        while (1)
        {
                printf("%s\n", (char*)p_arg);
                sleep(10);
        }
}
int main(void)
{
        pthread_t t1, t2;

        pthread_create(&t1, NULL, thread_func, "Thread 1");
        pthread_create(&t2, NULL, thread_func, "Thread 2");

        sleep(1000);
        return 0;
}
Breakpoint 1, main () at process.c:14
14  {
(gdb) n
17          pthread_create(&t1, NULL, thread_func, "Thread 1");
(gdb) n
[New Thread 0x7ffff7da6700 (LWP 28549)]
Thread 1
18          pthread_create(&t2, NULL, thread_func, "Thread 2");
(gdb) n
[New Thread 0x7ffff75a5700 (LWP 28550)]
Thread 2
20          sleep(1000);
(gdb) thread apply all bt

Thread 3 (Thread 0x7ffff75a5700 (LWP 28550)):
#0  0x00007ffff7e8b670 in __GI___nanosleep (requested_time=requested_time@entry=0x7ffff75a4ea0, remaining=remaining@entry=0x7ffff75a4ea0) at ../sysdeps/unix/sysv/linux/nanosleep.c:28
#1  0x00007ffff7e8b57a in __sleep (seconds=0) at ../sysdeps/posix/sleep.c:55
#2  0x0000555555555187 in thread_func (p_arg=0x55555555600d) at process.c:10
#3  0x00007ffff7f9e182 in start_thread (arg=<optimized out>) at pthread_create.c:486
#4  0x00007ffff7ec7b1f in clone () at ../sysdeps/unix/sysv/linux/x86_64/clone.S:95

Thread 2 (Thread 0x7ffff7da6700 (LWP 28549)):
#0  0x00007ffff7e8b670 in __GI___nanosleep (requested_time=requested_time@entry=0x7ffff7da5ea0, remaining=remaining@entry=0x7ffff7da5ea0) at ../sysdeps/unix/sysv/linux/nanosleep.c:28
#1  0x00007ffff7e8b57a in __sleep (seconds=0) at ../sysdeps/posix/sleep.c:55
#2  0x0000555555555187 in thread_func (p_arg=0x555555556004) at process.c:10
#3  0x00007ffff7f9e182 in start_thread (arg=<optimized out>) at pthread_create.c:486
#4  0x00007ffff7ec7b1f in clone () at ../sysdeps/unix/sysv/linux/x86_64/clone.S:95

Thread 1 (Thread 0x7ffff7da7740 (LWP 28545)):
#0  main () at process.c:20
(gdb) thread apply 1 bt

Thread 1 (Thread 0x7ffff7da7740 (LWP 28545)):
#0  main () at process.c:20
(gdb) thread apply 1-2  bt

Thread 1 (Thread 0x7ffff7da7740 (LWP 28545)):
#0  main () at process.c:20

Thread 2 (Thread 0x7ffff7da6700 (LWP 28549)):
#0  0x00007ffff7e8b670 in __GI___nanosleep (requested_time=requested_time@entry=0x7ffff7da5ea0, remaining=remaining@entry=0x7ffff7da5ea0) at ../sysdeps/unix/sysv/linux/nanosleep.c:28
#1  0x00007ffff7e8b57a in __sleep (seconds=0) at ../sysdeps/posix/sleep.c:55
#2  0x0000555555555187 in thread_func (p_arg=0x555555556004) at process.c:10
#3  0x00007ffff7f9e182 in start_thread (arg=<optimized out>) at pthread_create.c:486
#4  0x00007ffff7ec7b1f in clone () at ../sysdeps/unix/sysv/linux/x86_64/clone.S:95
(gdb)
可以受用命令thread apply all bt查看所有线程堆栈信息,同时使用thread-id可以显示部分线程堆栈信息。
只允许一个线程运行
#include <stdio.h>
#include <pthread.h>
#include <unistd.h>

int a = 0;
int b = 0;
void *thread1_func(void *p_arg)
{
        while (1)
        {
                a++;
                sleep(1);
        }
}

void *thread2_func(void *p_arg)
{
        while (1)
        {
                b++;
                sleep(1);
        }
}

int main(void)
{
        pthread_t t1, t2;

        pthread_create(&t1, NULL, thread1_func, "Thread 1");
        pthread_create(&t2, NULL, thread2_func, "Thread 2");

        sleep(1000);
        return 0;
}
Reading symbols from thread...
(gdb) b thread.c:9
Breakpoint 1 at 0x1161: file thread.c, line 11.
(gdb) r
Starting program: /root/workspace/gdb/thread
[Thread debugging using libthread_db enabled]
Using host libthread_db library "/lib/x86_64-linux-gnu/libthread_db.so.1".
[New Thread 0x7ffff7da6700 (LWP 28631)]
[New Thread 0x7ffff75a5700 (LWP 28632)]
[Switching to Thread 0x7ffff7da6700 (LWP 28631)]

Thread 2 "thread" hit Breakpoint 1, thread1_func (
    p_arg=0x555555556004) at thread.c:11
11                  a++;
(gdb) p b
$1 = 1
(gdb) n
12                  sleep(1);
(gdb)
11                  a++;
(gdb)

Thread 2 "thread" hit Breakpoint 1, thread1_func (
    p_arg=0x555555556004) at thread.c:11
11                  a++;
(gdb) p b
$2 = 5
(gdb)
thread1_func更新全局变量a的值,thread2_func更新全局变量b的值。我在thread1_func里a++语句打上断点,当断点第一次命中时,打印b的值是1,在单步调试thread1_func几次后,b的值变成5,证明在单步调试thread1_func时,thread2_func也在执行。
如果想在调试一个线程时,让其它线程暂停执行,可以使用“set scheduler-locking on”命令:
Reading symbols from thread...
(gdb) b thread
thread.c      thread1_func  thread2_func
(gdb) b thread.c:9
Breakpoint 1 at 0x1161: file thread.c, line 11.
(gdb) r
Starting program: /root/workspace/gdb/thread
[Thread debugging using libthread_db enabled]
Using host libthread_db library "/lib/x86_64-linux-gnu/libthread_db.so.1".
[New Thread 0x7ffff7da6700 (LWP 28646)]
[New Thread 0x7ffff75a5700 (LWP 28647)]
[Switching to Thread 0x7ffff7da6700 (LWP 28646)]

Thread 2 "thread" hit Breakpoint 1, thread1_func (p_arg=0x555555556004) at thread.c:11
11                  a++;
(gdb) set scheduler-locking on
(gdb) p b
$1 = 1
(gdb) n
12                  sleep(1);
(gdb) n
11                  a++;
(gdb) n

Thread 2 "thread" hit Breakpoint 1, thread1_func (p_arg=0x555555556004) at thread.c:11
11                  a++;
(gdb) n
12                  sleep(1);
(gdb) n
n11                 a++;
(gdb) n

Thread 2 "thread" hit Breakpoint 1, thread1_func (p_arg=0x555555556004) at thread.c:11
11                  a++;
(gdb) n
12                  sleep(1);
(gdb) p a
$2 = 3
(gdb) p b
$3 = 1
可以看到在单步调试thread1_func几次后,b的值仍然为1,证明在在单步调试thread1_func时,thread2_func没有执行。